Mastering Wealth Creation: A Comprehensive Guide to SIP & Lumpsum Investment Calculators

The Science Behind Investment Calculators
Modern SIP and Lumpsum calculators employ complex algorithms combining time-value-of-money principles with market volatility models to predict wealth creation scenarios. These tools analyze:
- • Compound interest with daily/weekly/monthly compounding
- • Inflation-adjusted return projections
- • Tax implications (LTCG, STCG, dividend distribution tax)
- • Expense ratio impact on mutual fund returns
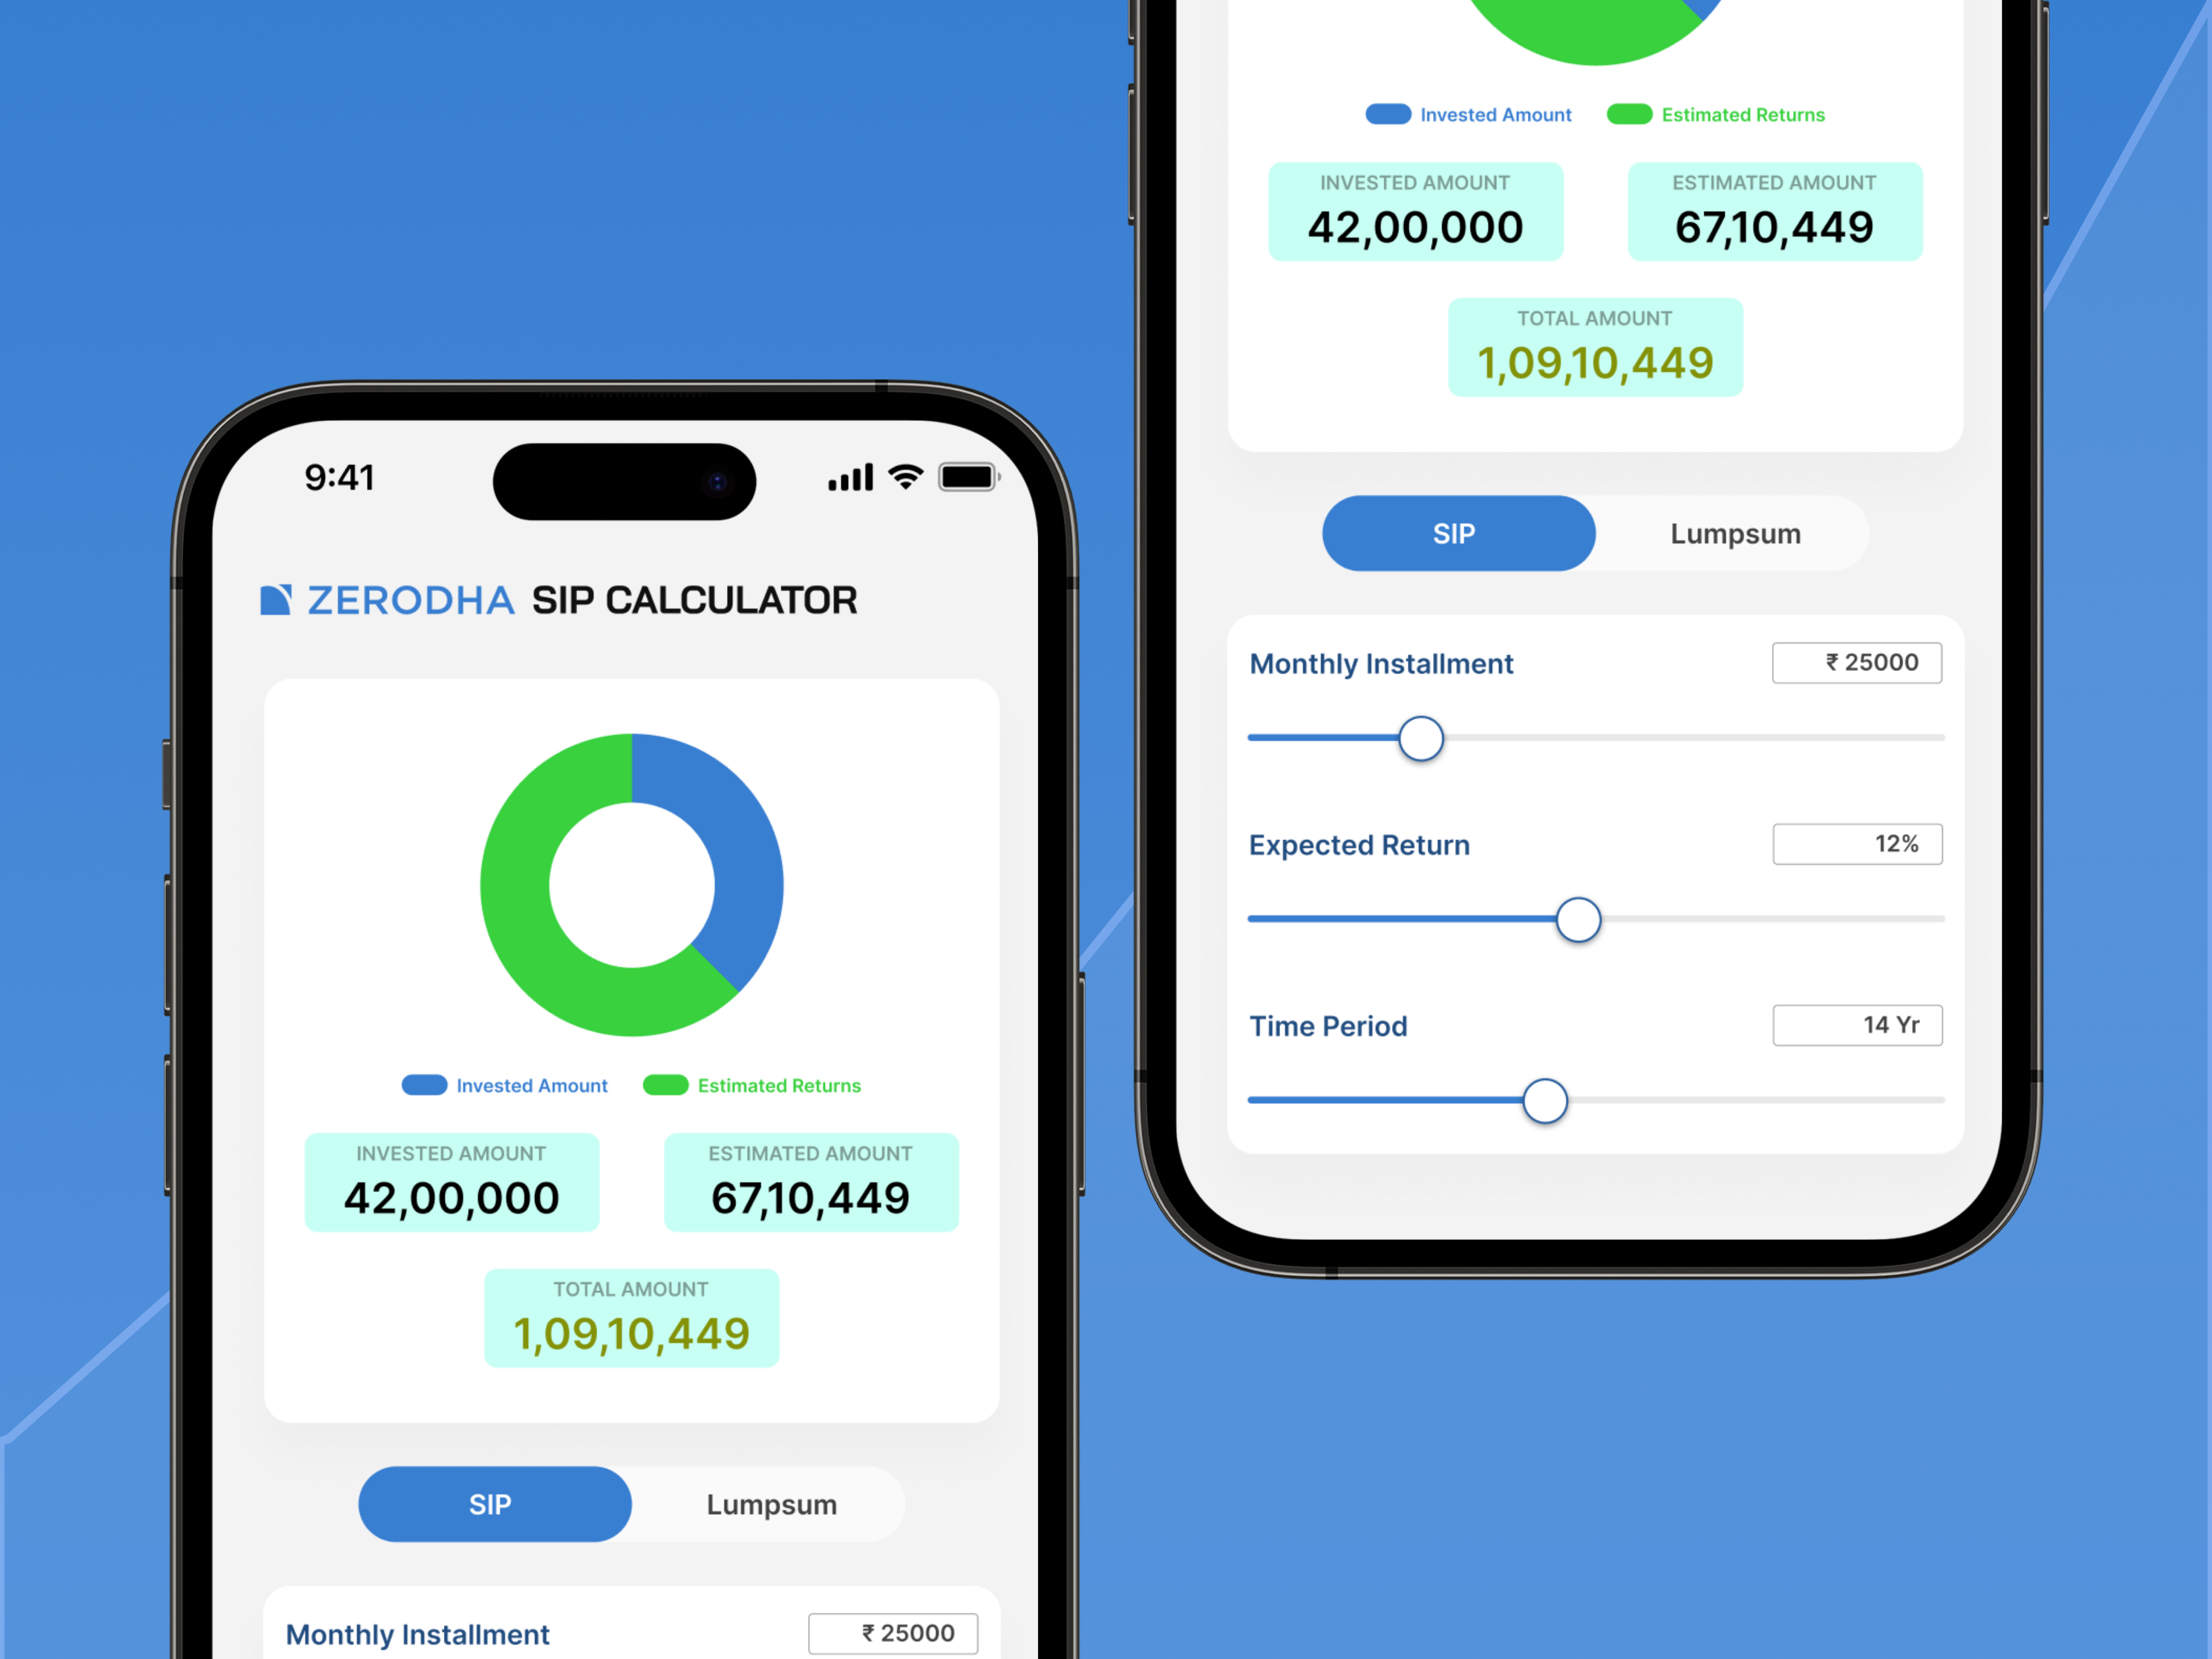
SIP Calculator: Dollar-Cost Averaging Decoded
Systematic Investment Plan calculators use the future value of annuity formula:
FV = P × [((1 + r)^n - 1) / r] × (1 + r)
Where:
FV = Future Value
P = Periodic investment
r = Periodic interest rate
n = Total number of payments
Advanced models incorporate volatility smoothing by analyzing historical market drawdowns and recovery periods.

Lumpsum Calculator: Power of Compounding
Lumpsum investment calculators utilize the compound interest formula:
A = P(1 + r/n)^(nt)
Where:
A = Final amount
P = Principal investment
r = Annual interest rate
n = Compounding frequency
t = Time in years
Sophisticated versions include Monte Carlo simulations showing 500+ market scenarios.
Strategic Applications for Different Goals
Wealth Accumulation
- • SIP for monthly savings (₹5,000-50,000)
- • Lumpsum for windfalls (bonuses/inheritance)
Retirement Planning
- • SIP with annual step-ups (10-15% increase)
- • Lumpsum NPS contributions for tax benefits
Advanced Calculator Features
| Feature | SIP Calculator | Lumpsum Calculator |
|---|---|---|
| Volatility Adjustment | Yes (3-year rolling returns) | Monte Carlo Simulation |
| Tax Efficiency | STCG/LTCG Calculator | Indexation Benefit Mode |
5 Critical Mistakes to Avoid
Common SIP Errors
- • Ignoring expense ratios
- • Underestimating inflation
Lumpsum Pitfalls
- • Market timing mistakes
- • Overlooking exit loads
SIP & Lumpsum Calculator FAQs:
SIPs typically outperform lumpsum investments during market downturns through rupee cost averaging. Historical data shows SIPs in NIFTY50 during 2008 crisis delivered 12% higher returns over 5 years.
Use real return calculations: Adjusted Return = (1 + Nominal Return)/(1 + Inflation Rate) - 1. Advanced calculators auto-apply 5-6% inflation defaults.
Use our calculator's "Step-Up SIP" feature to simulate annual increases (recommended 10-15%). A ₹10,000 monthly SIP with 12% annual step-ups grows 73% larger than fixed SIP over 15 years at 12% returns.
Minimum 7-10 years to benefit from full market cycles. ₹20,000/month SIP for 25 years at 12% returns becomes ₹3.47 crore vs ₹82 lakh for 15 years.
Enable "Tax Mode" in calculator:
- Equity Funds: 15% STCG (<1yr), 10% LTCG (>1yr over ₹1L)
- Debt Funds: Income tax slab rates after indexation (>3yr)
Yes. Use our "Hybrid Simulation" mode to model combinations like:
- Start with ₹5L lumpsum + ₹10k monthly SIP
- Convert 50% SIP to lumpsum during market dips
Historical data shows such strategies can boost returns by 2-3% annually.
A 1% higher expense ratio reduces 20-year returns by 23%. Our calculator auto-deducts expense ratios (default 0.5-2% based on fund type). ₹10k SIP at 12% for 20yrs:
- 0.5% TER: ₹99.91L
- 2% TER: ₹76.57L
Ideal lumpsum investments start at ₹50,000+ to offset transaction costs. ₹5L+ allows proper asset allocation. Our calculator shows ₹10L lumpsum at 12% over 15yrs grows to ₹54.74L vs ₹1Cr via SIP ₹15k/month.
Enable "Market Crash Simulation" to test scenarios:
- 30% drop in Year 3
- 5-year recovery period
Historical analysis shows SIPs recover 18 months faster than lumpsum post-2008 crisis.
Enable "Market Crash Simulation" to test scenarios:
- 30% drop in Year 3
- 5-year recovery period
Historical analysis shows SIPs recover 18 months faster than lumpsum post-2008 crisis.
Optimal strategy combines both:
1. Regular SIPs (60-70% of portfolio)
2. Lumpsum NPS contributions (tax benefits)
3. Annual lumpsum top-ups during corrections
Calculator's "Retirement Mode" auto-allocates based on age and risk profile.